Data Breakdown: 2023 U.S. Vehicle Ownership Statistics (PDF)
Americans place a high value on car ownership, according to the latest data on the subject in the United States. During the period 2017-2021, registrations for personal and commercial vehicles increased by 3.66 percent. According to the latest data available, 91.7 percent of U.S. families had at least one vehicle in 2021, and 22.1% had three or more.
Using the latest available data, we reveal car ownership rates by state, the most popular car models, and more.
What Is the Number of Cars in the U.S.?
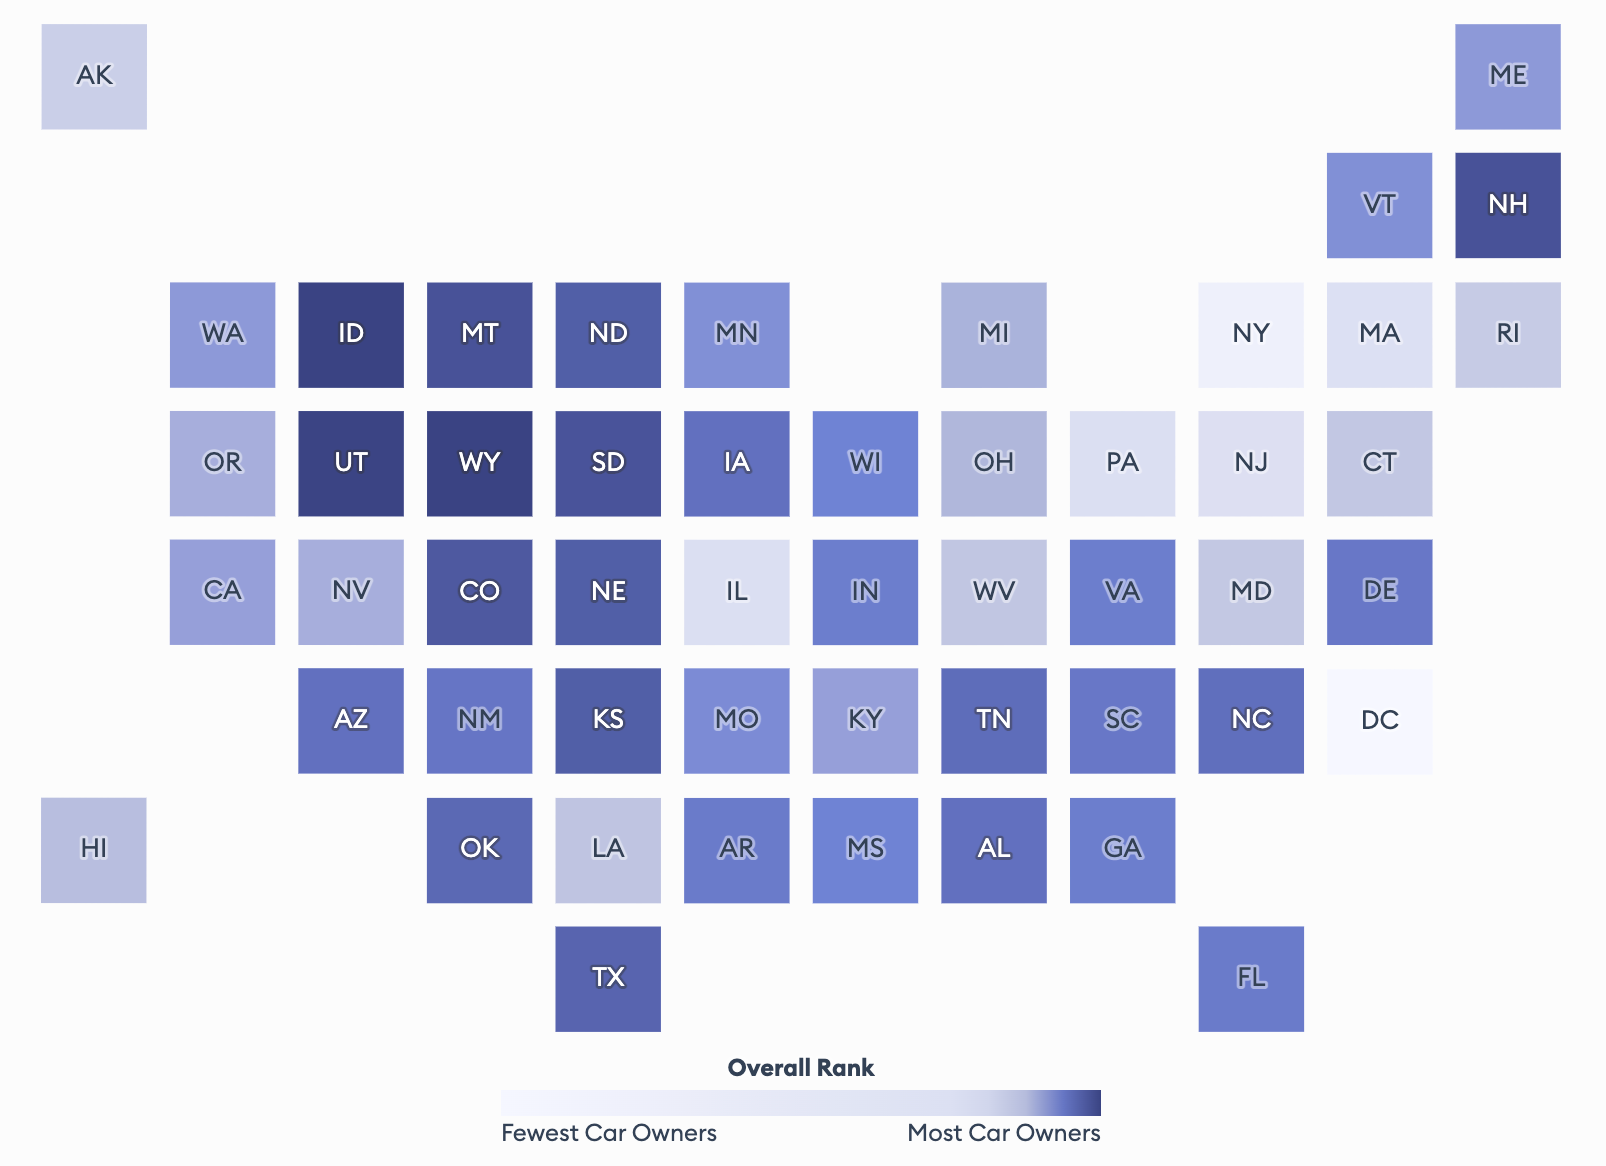
In 2021, there were a total of 278,063,737 vehicles registered in the US, with the state of Montana having the most motor vehicle registrations per 1,000 licensed drivers with 2,492.55.
Between 2017 and 2021, the number of registered vehicles in the United States increased by 3.66%, from 268,258,178 to 278,063,737, indicating an upward trend.
The most popular vehicle type in 2021 was trucks, with 166,079,082 private and commercial vehicle registrations, compared to 101,601,344 for cars.
| Top 10 States With the Highest Number of Registered Vehicles | |||
| Motor Vehicle Registrations |
|||
| Rank | State | Per 1,000 Licensed Drivers (2021) | Percentage Change (2017-2021) |
| 1 | Montana | 2492.55 | 18.18% |
| 2 | South Dakota | 2067.69 | 12.48% |
| 3 | Wyoming | 2015.58 | 8.23% |
| 4 | North Dakota | 1643.66 | −12.87% |
| 5 | Iowa | 1619.97 | 2.44% |
| 6 | Arkansas | 1514.37 | 25.08% |
| 7 | Idaho | 1465.90 | 8.07% |
| 8 | Kentucky | 1447.39 | 2.66% |
| 9 | Indiana | 1343.94 | 1.42% |
| 10 | Alabama | 1343.27 | 10.34% |
What is the Average Number of Cars Owned by Americans?
In 2021, 8.3% of households lacked a vehicle, a 5.7% decrease from 2017, when 8.8% of households didn’t have one.
- In 2021, 91.7% of households owned at least one vehicle, up from 91.2% in 2017.
- In 2021, 37.1% of households had two vehicles, a 0.8% decrease from 2017 (37.4%).
- In 2021, 22.1% of households had three or more vehicles, an increase of 7.28% from 2017.
| Percentage of American Car Ownership | |||
| % of households | % change | ||
| Number of vehicles | 2017 | 2021 | 2017-2021 |
| 0 | 8.80% | 8.30% | -5.68% |
| 1 | 33.20% | 32.50% | -2.11% |
| 2 | 37.40% | 37.10% | -0.80% |
| 3 or more | 20.60% | 22.10% | 7.28% |
Top 10 Most Popular Cars in the U.S.
There were 653,957 Ford F-Series pickups sold in 2022, making it the most popular vehicle model nationwide. Check the top 10 most popular car models in 2022:
| Top 10 Most Popular Cars in the U.S. | |||
| Rank | Make | Model | 2022 Sales |
| 10 | Jeep | Grand Cherokee | 223,345 |
| 9 | Toyota | Tacoma | 237,323 |
| 8 | Honda | CR-V | 238,155 |
| 7 | GMC | Sierra | 241,522 |
| 6 | Tesla | Model Y | 252,000 |
| 5 | Toyota | Camry | 295,201 |
| 4 | Toyota | RAV4 | 399,941 |
| 3 | Ram | Pickup | 468,344 |
| 2 | Chevrolet | Silverado | 513,354 |
| 1 | Ford | F-Series | 653,957 |